Interpreting Visualizations#
Fuels#
Type#
In EMBRS visualizations, each cell in the fuel state is assigned a color based on the type of fuel in that cell (see Fuels). There will also be a fuel legend in the top right of the visualization window displaying what each color represents. Below is a mapping of fuel type to cell color:
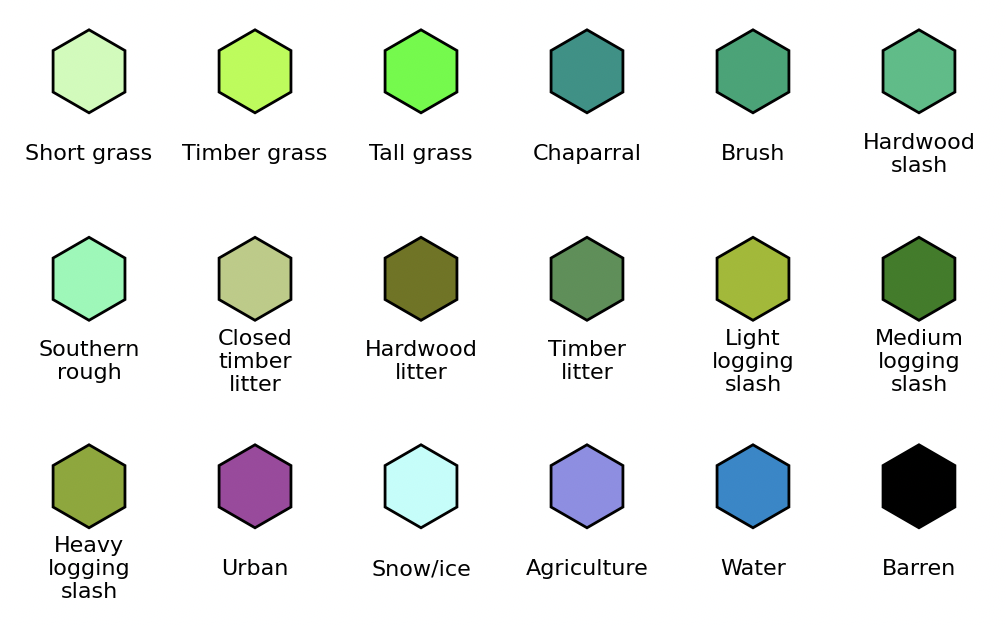
Fig. 6 Fuel colors#
Fuel Content#
If a cell’s fuel content is less than 100% while it is in the fuel state its color will be scaled based on its fuel content, cells with less fuel will appear duller than their original color. This case occurs if a cell was partially burned by a prescribed burn (see Prescribed burning) or if it is in a cell that contains a road (see Roads). Below is a mapping of fuel content to color of a cell containing ‘Tall grass’:
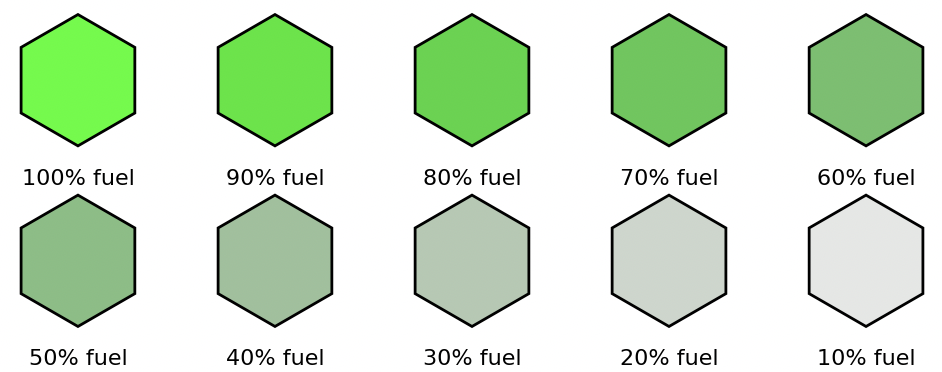
Fig. 7 ‘Tall grass’ color by fuel remaining#
Fire-breaks#
If a fire-break is specified in a map (see Map Creation:Fire-breaks) the fuel color will be overwritten with a shade of grey. The shade of grey depends on the fuel remaining within the fire-break (see Fire Modelling:Fire-breaks). Below is a mapping of fuel content in a fire-break to the cell color:
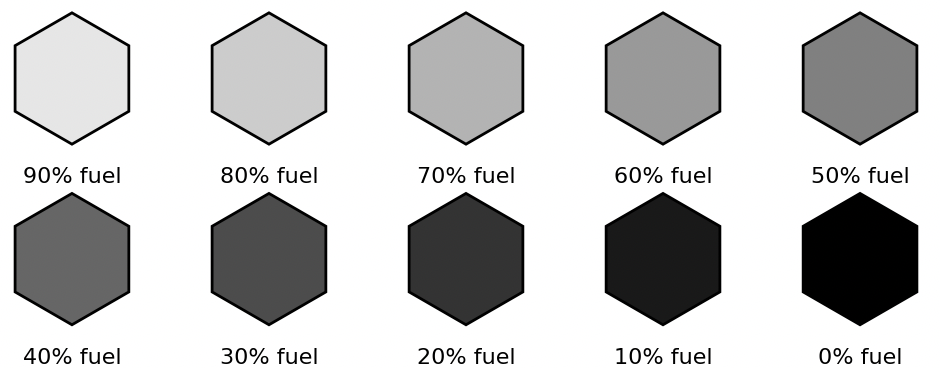
Fig. 8 Fire-break colors by fuel remaining#
Roads#
Roads are displayed in visualizations as lines. These lines are each a different shade of pink depending on the OpenStreet map classification of each road (see Fire Modelling:Roads). The fuel legend will include entries for the road colors included in the map. Below is a mapping of road classification to line color:
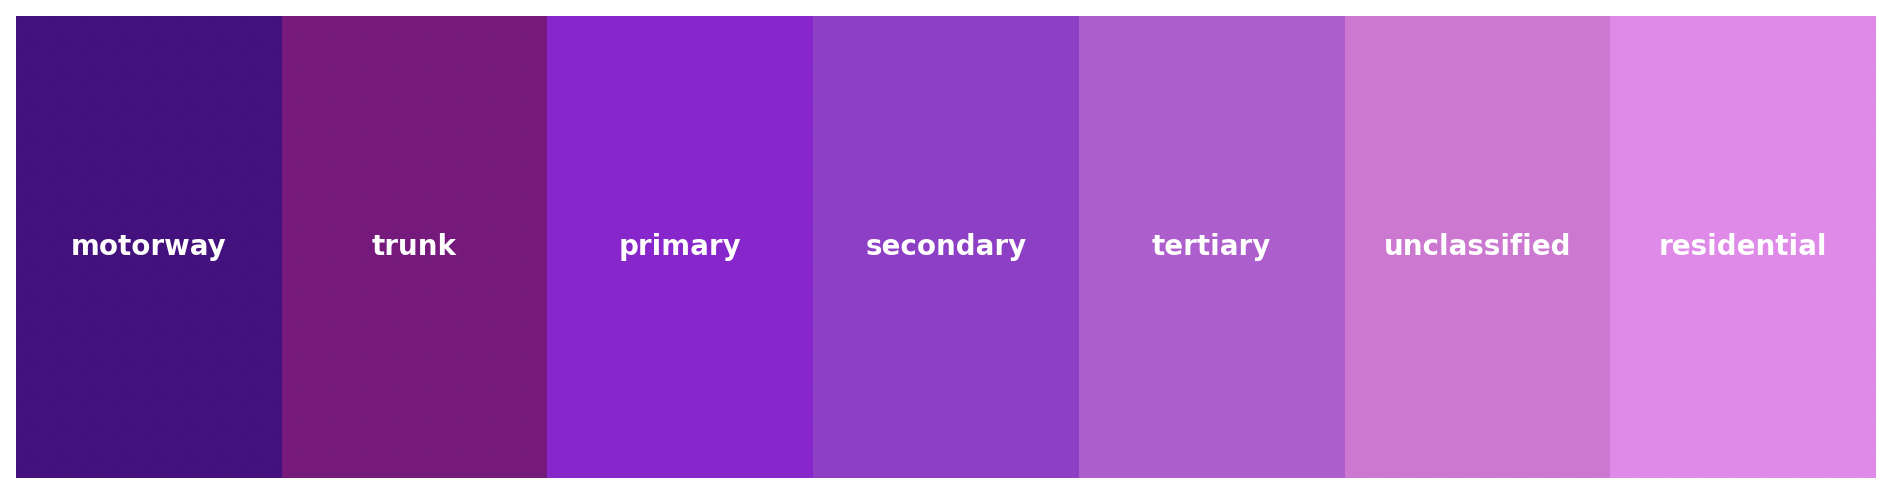
Fig. 9 Road colors by road classification#
Fire#
Fuel content#
When a cell is on fire its color depends on the amount of fuel remaining within it (see Fire Modelling:Fuel Content). As the fuel within a cell is burnt the cell’s color becomes increasingly darker shades of orange until it is black when it runs out. Below is a mapping of a burning cell’s fuel content to the cell color:
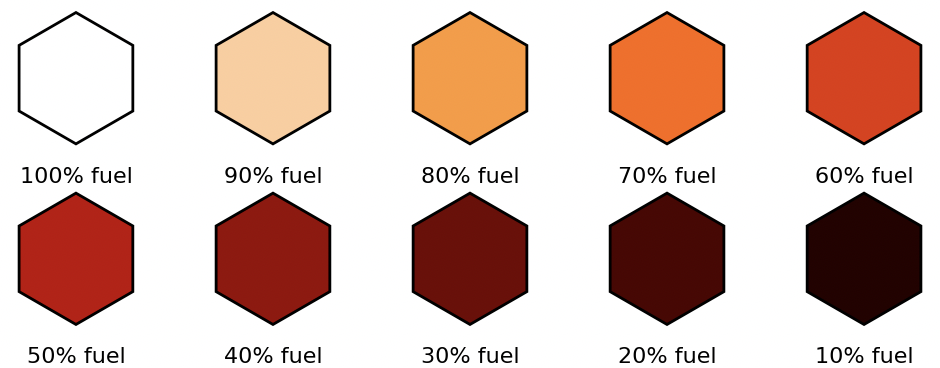
Fig. 10 Fire colors by fuel remaining#
Elevation#
The elevation of each cell in the map is not explicitly displayed by the visualizations. Instead, a contour map is used to show the general topography of the region in question. Each contour line is labeled with the elevation along it, specified in meters above sea level.
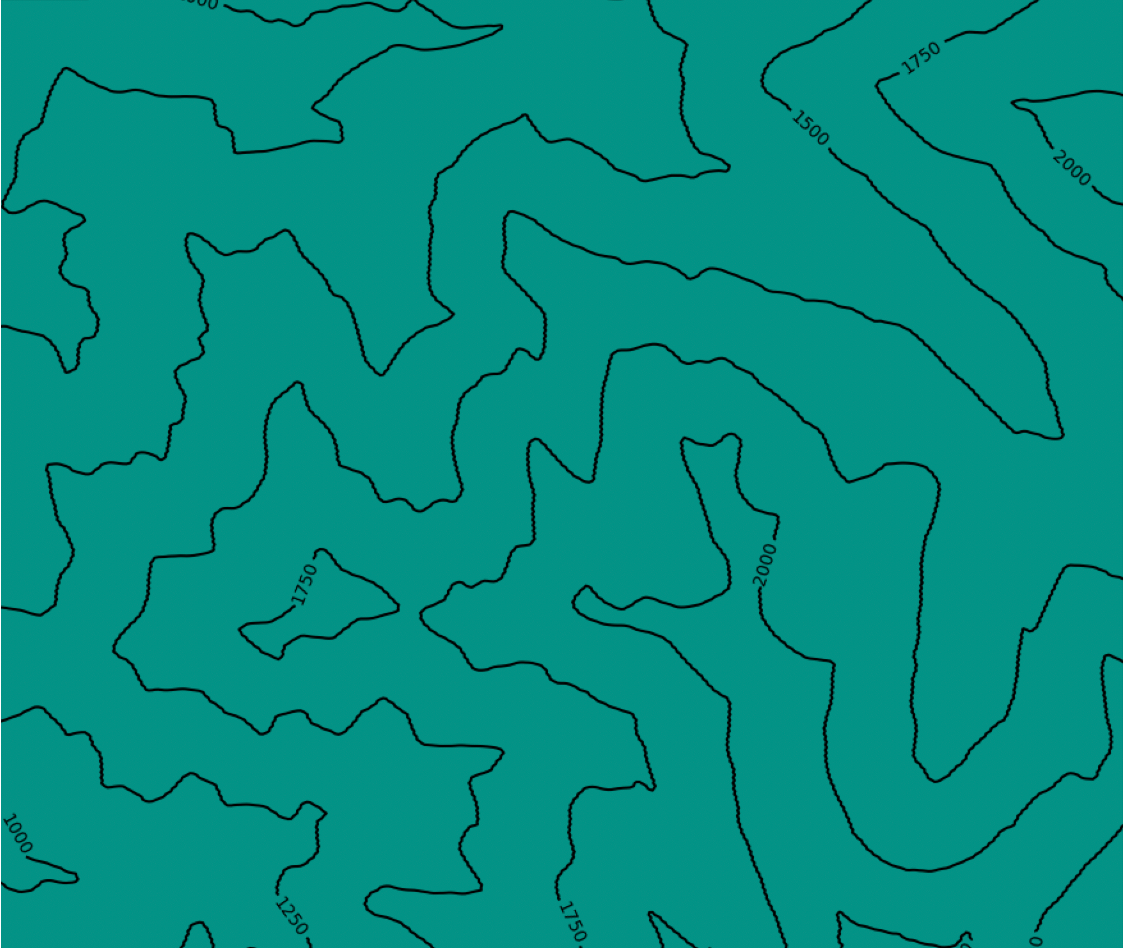
Fig. 11 Example elevation visualization#
Wind and Time#
The current wind conditions are displayed in the top left with an arrow that shows the direction and a label below it that shows the speed specified in meters per second. Above the wind visualization you can see the current sim time being displayed.
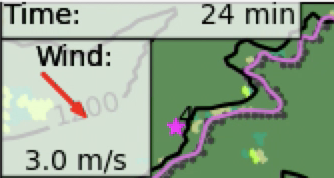
Fig. 12 Example of the wind and time display#