Sim Visualization#
As mentioned in ‘Running a Sim’ EMBRS simulations can be visualized in real-time by selecting that option when starting a sim. However, this is not the recommended way to visualize your simulations. EMBRS comes with a dedicated visualization tool that runs visualizations of previously run simulations from their log files.
Step 1: Open the Visualization Tool#
Run the following command in your terminal.
run_embrs_viz
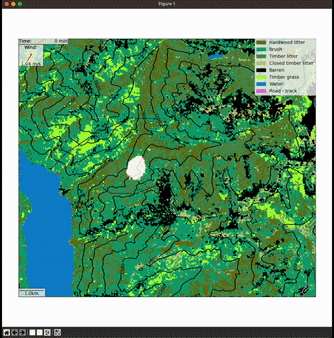
After running this command you should now see the following window:
Step 2: Select Log File#
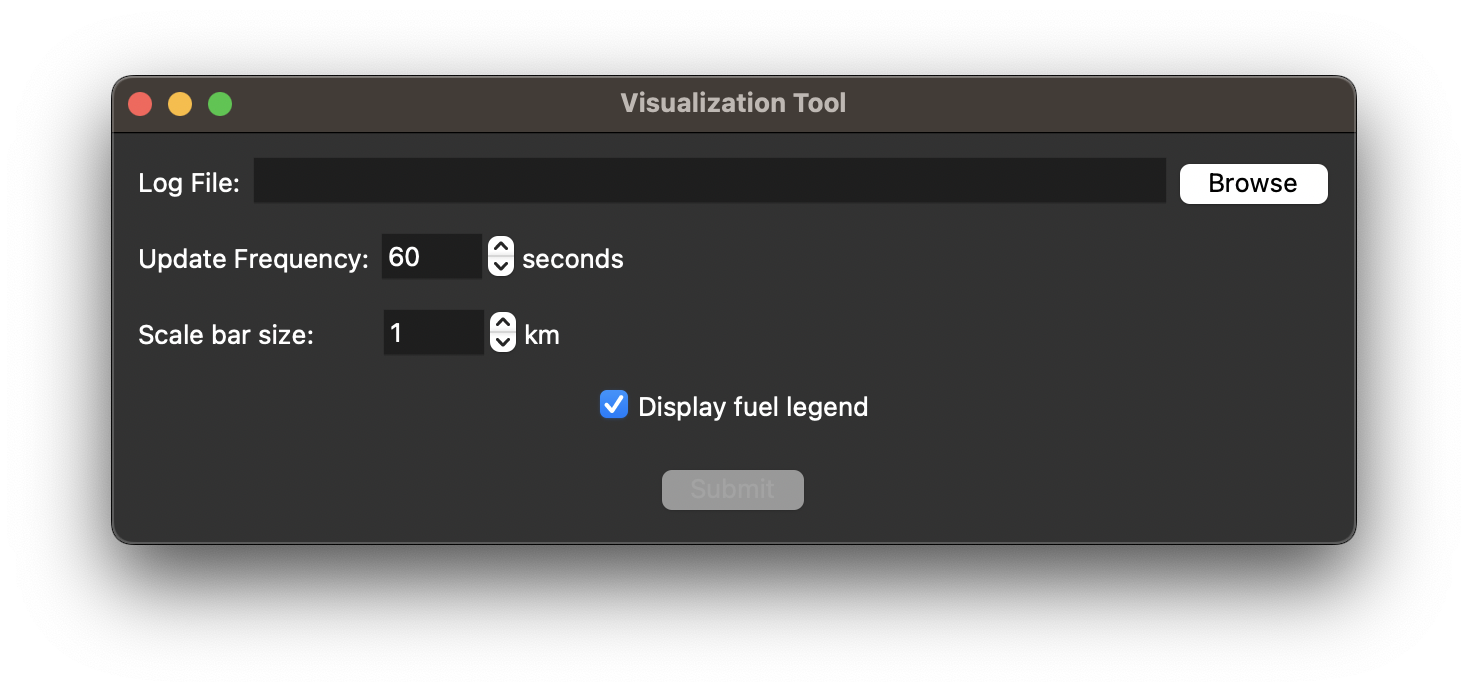
The first field prompts you to provide a log file for the sim to visualize.
Click ‘Browse’ and navigate to the folder that holds the log file for the simulation would like to visualize. This should be in the ‘run’ folder and it should be named
log.msgpack. Make sure that there is aninit_fire_state.pklfile in the directory above the log file.
Step 3: Select Visualization Parameters#
Once you have selected the log file there are three visualization parameters to set before running a visualization.
Update Frequency#
The update frequency determines how often (in sim time) the display is updating. For example, if you enter 60 seconds as your update frequency the visualization will display the initial state, the state of the simulation after 1 minute of sim time, the state after 2 minutes of sim time, and so on.
Obviously, smaller update frequencies will provide smoother visualizations, but performance may be affected if it is too small.
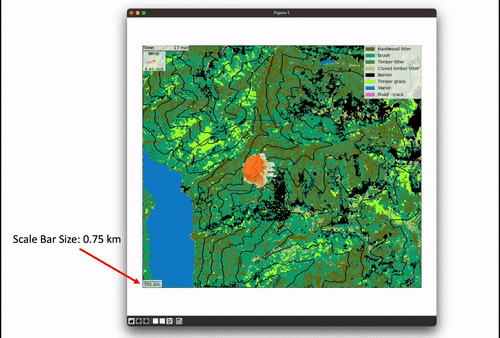
Scale Bar Size#
The scale bar size determines what the scale bar in the bottom left of the visualization window will represent.
You can enter any float value for the scale bar size, if you enter a value less than 1 km the visualization will handle this and display the scale bar in meters.
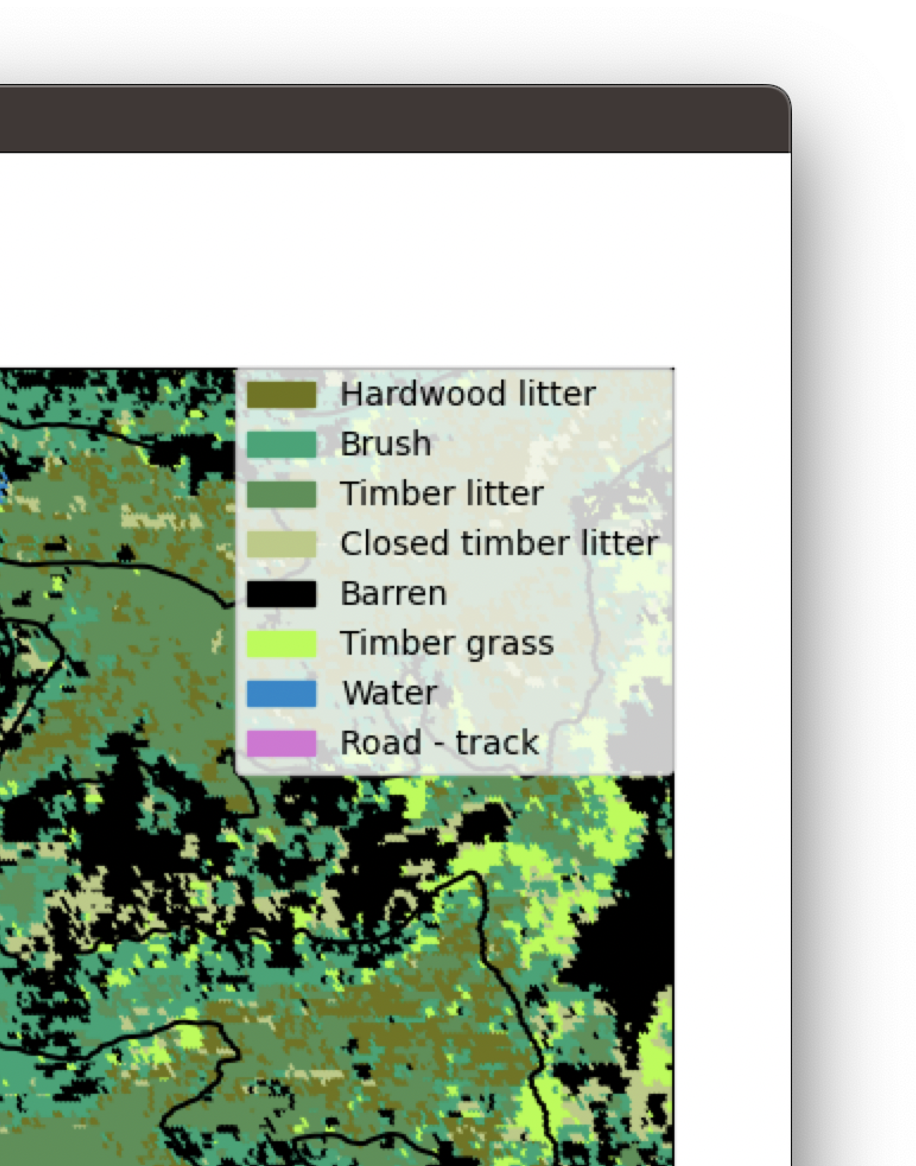
Display Fuel Legend#
Finally, you have the option to display a fuel legend in the top right or to hide it.
The fuel legend provides a mapping between the colors displayed on the visualizations to the fuel type that they represent.
Step 4: Visualization#
Once all the parameters are set to your liking, click ‘Submit’ to run a visualization.
Depending on the simulation and your parameters it may take a minute for the display to pop up.
Once it has loaded the visualization will run in a loop until you close the window.
After closing the window the initial visualization window will remain open and you can tweak any of the parameters or change the log file to display and run another visualization.
If you are done with all your visualizations you can close this window to quit, or press ‘Ctrl+c’ in the command line.
For help interpretting visualizations, see ‘Interpreting Visualizations’